It’s the NFL in June … it’s not the most riveting point of the football schedule. What better time to predict what’s to come in 2019?
You can hear the discussion Turron Davenport and I had on this topic from last week’s Talking w/ TD. Every week I bring an analytical topic to the table for Turron’s outstanding podcast, and this article is a branch off from that.
If you don’t know me I’ll quickly introduce myself and what I’ll be doing for The Game throughout the Titans season (if you don’t care just skip ahead two paragraphs). I’m Calvin Smith a Co-host/Producer with 102.5 The Game.
I’ll be at Titans practices, games and press conferences this fall to provide the best coverage of the two-tone blue this season. I’ll bring plenty of social media videos and analysis on my personal Twitter account @SmithACalvin and for @1025TheGame. I’ll be heavily involved with ESPN Reporter Turron Davenport‘s podcast and The Game’s social media accounts, so if you don’t follow us there be sure to stay up to date and hit the follow button.
WARNING: Much of my content will be analytically focused, if you don’t know your numbers you don’t know your business.
Now that introductions are out of the way let’s get down to our business. This study looks at the impact of salary cap spending on succeeding in the AFC South.
The Tennessee Titans seem primed for a good season based on their active salary cap total.
There’s a difference between the active salary cap and a team’s total salary cap number. The active cap total is a dollar figure that tells how much money a team is spending for active players on the roster. Opposed to the total cap which includes dead money (cap space allocated to released players) and reserve listed players.
To test the importance of player salary totals, I set up a table to test correlations then formed a simple regression model, which is shown below. If you aren’t a graph-geek don’t worry, I’ll break it all down. This data is from the last six seasons and comes from Spotrac.
A red dot is the Houston Texans, a blue dot the Indianapolis Colts, a green dot the Jacksonville Jaguars, and the (darker) blue stars are the Titans. The division finish signifies where in the AFC South the particular team finished in a year, i.e. 1 = first in the division.
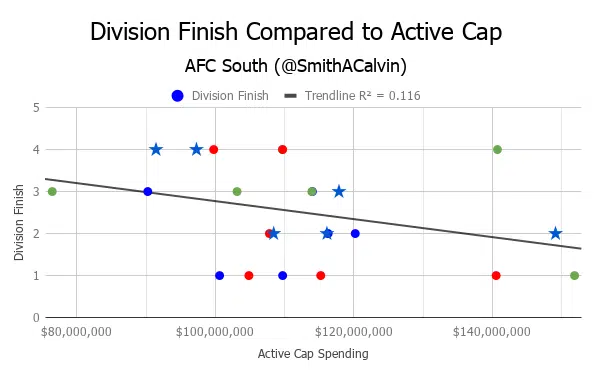
Notice the downward slope of the black trendline between all of the dots. As active cap spending increases, your finish in the division improves. This isn’t groundbreaking news, typically better players cost more money and good players lead to wins.
If your players are healthy they’re counted in the active cap, so it’s a nice indicator of health on your roster. Healthy and expensive (presumably good) players will tend to lead to more wins.
However, the numeric correlation between division finish and active spending isn’t incredibly high. Intuitively and numerically there’s a relationship between high active cap totals and placing well in the division, but the relationship over the last six seasons for the division as a whole is only correlated at -34%. (If you want to read about the math behind Pearson’s Correlation Coefficient here’s a link to learn what it means)
It puzzles me that this relationship isn’t stronger, in my mind all the components are there. Active cap mostly factors in health and talent on your roster so it should correlate strongly to success, but they don’t for the AFC South as a whole.
Things get interesting because the Titans’ correlation between active cap spending and division finish equals -72%. Now that is a number you look at and feel some significance behind. The graph for the Titans is below.
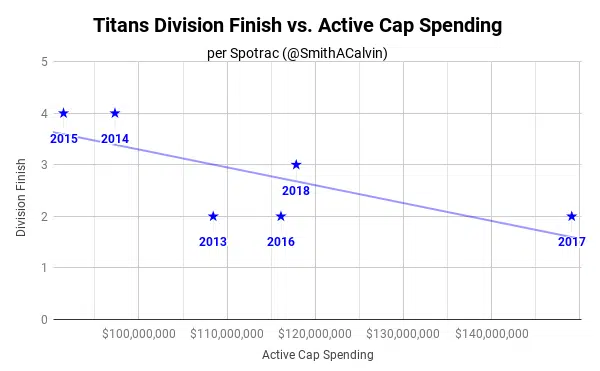
There are a few things to note here, first off the downward slope as spending increases. Spend more and you’ll probably win more. What’s the difference between 2017 finishing 2nd and 2018 finishing 3rd? The active cap total shows a glaring difference of more than 30 million dollars.
Both times the Titans finished in the cellar of the AFC South they spent the least amount in this six year window. They came in second in the division in 2013, then for the following two years spending fell and success was at its lowest point.
Let’s run with what we have because here’s a nice trend here. Based on the active cap numbers on Spotrac as of this writing, the Titans have the second highest active cap total in the division. They trail the Colts by less than one-hundred thousand dollars.
If you believe in the -72% correlation’s significance, then it’s likely the Titans will place in the top half of the AFC South.
Granted, a lot will change between now and the end of training camp, the preseason and the start of the season. Players will be cut, some guys will sign late, but for now the Titans seem likely to have a solid season based on the small amount of data above.
This is a stat I’ll keep a close eye on as we continue to inch closer to the season.
If you’d like to suggest a story idea follow and tweet Calvin Smith on Twitter @SmithACalvin


Comments